
PDM in the Vila Real District, Municipal Master Plans
In the Vila Real district, each municipality defines through its Municipal Master Plan where you can build and under what conditions. Compare urban land, mapped zones and amendments for each PDM.
PDM changes
Every amendment to municipal master plans, straight from the national registry (SNIT). Pick a district, municipality or parish on the map to scope this list; click a row to see it on the map.
| Municipality | District | Change | Publication | Date |
|---|---|---|---|---|
| Loading… | ||||
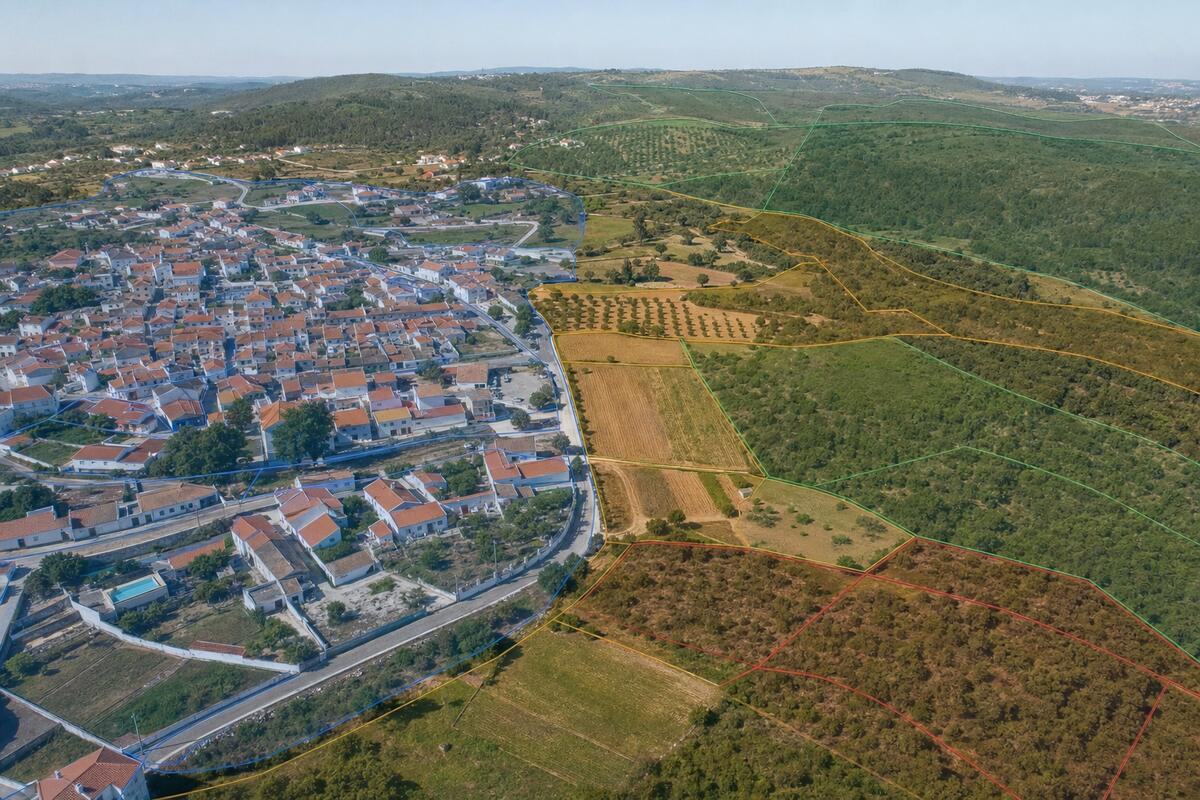
Where can you build in the Vila Real district?
In the Vila Real district, each municipality defines through its Municipal Master Plan where you can build and under what conditions. The share of urban land varies from one municipality to another. In the pages below you can compare the percentage of urban territory, the number of mapped zones and the amendments already made to each PDM. Pick a municipality to see its zoning map and what you can build.
Municipalities in Vila Real
- Alijó5.4% urban · 743 zones
- Boticas3.8% urban · 713 zones
- Chaves3.2% urban · 900 zones
- Mesão Frio9.7% urban · 451 zones
- Mondim de Basto4.9% urban · 844 zones
- Montalegre2% urban · 534 zones
- Murça5.6% urban · 349 zones
- Peso da Régua9.8% urban · 126 zones
- Ribeira de Pena3.4% urban · 1328 zones
- Sabrosa6% urban · 472 zones
- Santa Marta de Penaguião8.2% urban · 1130 zones
- Valpaços3.6% urban · 1559 zones
- Vila Pouca de Aguiar4.8% urban · 1895 zones
- Vila Real11.9% urban · 1055 zones
Reclassification opportunities
691 rural zones here are scored for reclassification potential.
The ranked list, the map layer, the signals behind each score and the AI evaluation are part of Radar.
See Radar